navigation
Home
admin
|
Nagios
October 18th, 2016
|
| Table des matières |  |
Critiques
Installation sur une debian wheezy
Fichiers et répertoires importants
Monitorer des switchs
Capturer des traps SNMP
Modes passif et actif
Nagios Checker
Monitorer les disques d'un linux
Monitorer un Windows
Monitorer un DELL
Les codes retour des plugins
Les seuils avec check_snmp
Docs
| Critiques | |
"Il était une fois un moteur nagios ...
Si comme moi vous avez été amené a mettre en oeuvre plusieurs nagios, vous avez sûrement dû vous frotter a son interface Web a base de cgi et de fichier plat exporter toutes les 10 secondes.
Ne crachons pas dans la soupe, cette interface reste très bien pour une petite installation.
Malheureusement, avec l'évolution des besoins en supervision, il devient de plus en plus difficile de se contenter de cette interface. En vrac, on va donner les éléments suivants :
Interface vieillissante qui (en dehors des nouveaux CSS des dernières version de nagios) n'a plus évolué depuis de nombreuses années ;
Nécessité d'héberger les CGI sur la même machine que le moteur nagios ;
Overhead d'écriture du fichier status.dat ;
Désynchronisation de l'interface avec le moteur nagios (pour lancer un test immédiat - même dans le cas d'un test très court - l'interface vous rend la main tout de suite et vous devez attendre le lancement du test + le temps de rafraîchissement du fichier status.dat) ;
Explosion des temps de réponse dans le cas d'une grosse installation ;
Dans le cas où vous auriez plusieurs nuds nagios, vous devez vous connecter sur la bonne interface pour consulter votre serveur."
Source : http://lesaventuresdeyannigdanslemondeit.blogspot.fr/2012/10/thruk-une-alternative-linterface-web-de.html
| Installation sur une debian wheezy | |
Source : http://doc.ubuntu-fr.org/nagios
 Installation des paquets Installation des paquets
Vous devriez avoir accès à la page principale de Nagios une fois que vous avez introduit votre mot de passe en consultant l'URL suivante, le login étant « nagiosadmin » : http://localhost/nagios3/
Ajout de nouveaux utilisateurs
htpasswd /etc/nagios3/htpasswd.users <user> |
/etc/nagios3/conf.d/contacts_nagios2.cfg et /etc/nagios3/conf.d/contacts.cfg
 Définitions des contacts. Définitions des contacts.
/etc/nagios3/conf.d/hosts.cfg
Définitions des hosts à surveiller.
/etc/nagios3/conf.d/hostgroups.cfg
Les hosts sont groupés. On indique les contacts à prévenir en cas de pb.
| Fichiers et répertoires importants | |
Les fichiers et répertoires ci-dessous sont présentés dans leur ordre d'utilisation (on définit des scripts, puis des commandes qui les utilisent, puis des services qui les utilisent puis on les affecte à des hosts)
/usr/lib/nagios/plugins/
scripts de vérifications :
root@monitor3:/etc/nagios-plugins/config# ls /usr/lib/nagios/plugins/
check_apt check_email_delivery check_icmp check_libs check_nntps check_radius check_soas check_whois
[...] |
/etc/nagios-plugins/config
définition de commandes qui vont utiliser les scripts définis ci-dessus.
root@monitor3:/etc/nagios-plugins/config# ls
apt.cfg dns.cfg ftp.cfg httpd_status.cfg load.cfg multipath.cfg ntp.cfg radius.cfg ssh.cfg webinject.cfg
breeze.cfg dummy.cfg games.cfg
[...] |
root@monitor3:/etc/nagios-plugins/config# more mail.cfg
# 'check_pop' command definition
define command {
command_name check_pop
command_line /usr/lib/nagios/plugins/check_pop -H '$HOSTADDRESS$'
}
[...] |
/etc/nagios/conf.d/services.cfg
La notion de service fait la jointure entre un groupe de machines (hostgroup_name) et une commande (check_command)
root@monitor3:/etc/nagios3/conf.d# more services.cfg
# check that web services are running
define service {
hostgroup_name imap-servers
service_description IMAP
check_command check_imap
use generic-service
notification_interval 0 ; set > 0 if you want to be renotified
}
[...] |
/etc/nagios/conf.d/hostgroups.cfg
on définit quels sont les hotes qui font partie de ce groupe
# A list of your web servers
define hostgroup {
hostgroup_name http-servers
alias HTTP servers
members localhost, serveur1
} |
| Monitorer des switchs | |
apt-get install nagios-snmp-plugins |
De la doc : http://nagios.proy.org/index_snmp.html
cp /usr/share/doc/nagios3-common/examples/template-object/switch.cfg /etc/nagios3/switch.cfg.txt |
cp /usr/share/doc/nagios3-common/examples/template-object/templates.cfg.gz /etc/nagios3
gunzip templates.cfg.gz
mv templates.cfg templates.cfg.txt |
Statut d'un appareil
# snmpstatus -c 'mycoro' -v2c 192.168.101.252
[UDP: [192.168.101.252]:161->[0.0.0.0=>[Cisco Internetwork Operating System Software
IOS (tm) EW, EARLY DEPLOYMENT RELEASE SOFTWARE (fc1)
TAC Support: http://www.cisco.com/tac
Copyright (c) 1986-2002 by cisco Systems, Inc.
C] Up: 412 days, 20:50:21.95
Interfaces: 134, Recv/Trans packets: 1672364680/-538130954 | IP: 749900396/461885482
53 interfaces are down! |
| Capturer des traps SNMP | |
Source : http://xavier.dusart.free.fr/nagios/snmptraps.html
snmpttconvertmib : Cannot find module (SNMPv2-SMI)
Pour debian : utiliser le dépot "non-free"
puis
apt-get install snmp-mibs-downloader
download-mibs |
Configuration de l'agent SNMP distant
On peut utiliser un script pour envoyer des traps SNMP
cf par exemple : http://perso.univ-lemans.fr/~brichard/surveillance/?doc=Snmp#snmptrap
On peut s'appuyer sur une MIB perso : http://perso.univ-lemans.fr/~brichard/surveillance/?doc=Snmp#mymib
Configuration du gestionnaire d'interruptions SNMP
Modif de /etc/snmp/snmptrapd.conf qui doit contenir :
traphandle default /usr/sbin/snmptt
disableAuthorization yes
donotlogtraps yes |
Modif de /etc/default/snmpd
OPTIONS="-On -Lsd -p /var/run/snmptrapd.pid" |
Modif de /etc/snmp/snmptt.ini
[General]
mode = standalone
multiple_event = 1
dns_enable = 1
strip_domain = 2
strip_domain_list = <<END
mondomaine.fr
monautredomaine.fr
END
resolve_value_ip_addresses = 0
net_snmp_perl_enable = 1
net_snmp_perl_best_guess = 0
translate_log_trap_oid = 0
translate_value_oids = 1
translate_enterprise_oid_format = 1
translate_trap_oid_format = 1
translate_varname_oid_format = 1
translate_integers = 1
wildcard_expansion_separator = " "
allow_unsafe_regex = 0
remove_backslash_from_quotes = 0
dynamic_nodes = 0
description_mode = 0
description_clean = 1
[Logging]
stdout_enable = 0
log_enable = 1
log_file = /var/log/snmptt.log
unknown_trap_log_enable = 1
unknown_trap_log_file = /var/log/snmpttunknown.log
statistics_interval = 0
syslog_enable = 1
syslog_facility = local0
syslog_level_debug = <<END
END
syslog_level_info = <<END
END
syslog_level_notice = <<END
END
syslog_level_warning = <<END
END
syslog_level_err = <<END
END
syslog_level_crit = <<END
END
syslog_level_alert = <<END
END
syslog_level = info
syslog_system_enable = 1
syslog_system_facility = local0
syslog_system_level = warning
[Exec]
exec_enable = 1
pre_exec_enable = 0
unknown_trap_exec =
[Debugging]
DEBUGGING = 0
DEBUGGING_FILE =
DEBUGGING_FILE_HANDLER =
[TrapFiles]
snmptt_conf_files = <<END
/etc/snmp/snmptt.conf
END
|
"Compilation" des MIB
snmpttconvertmib --in=<fichier MIB> --out=/etc/snmp/snmptt.conf.<equipement>
--exec='/usr/local/nagios/libexec/eventhandlers/submit_check_result $r TRAP 1' |
Ajout au fichier de configuration /etc/snmp/snmptt.ini des fichiers générés
[...]
[TrapFiles]
snmptt_conf_files = <<END
/etc/snmp/snmptt.conf.<equipement1>
/etc/snmp/snmptt.conf.<equipement2>
END |
Machine cliente
Elle doit être configurée en mode passif et en mode actif pour la remise à zéro du status (cf #passifvsactif )
Pour récupérer tous les évènements, il faut désactiver le flapping :
| Modes passif et actif | |
In most cases you'll use Nagios to monitor your hosts and services using regularly scheduled active checks. Active checks can be used to "poll" a device or service for status information every so often. Nagios also supports a way to monitor hosts and services passively instead of actively. They key features of passive checks are as follows:
Passive checks are initiated and performed by external applications/processes
Passive check results are submitted to Nagios for processing
The major difference between active and passive checks is that active checks are initiated and performed by Nagios, while passive checks are performed by external applications.
Uses For Passive Checks
Passive checks are useful for monitoring services that are:
Asynchronous in nature and cannot be monitored effectively by polling their status on a regularly scheduled basis
Located behind a firewall and cannot be checked actively from the monitoring host
Examples of asynchronous services that lend themselves to being monitored passively include SNMP traps and security alerts. You never know how many (if any) traps or alerts you'll receive in a given time frame, so it's not feasible to just monitor their status every few minutes.
Passive checks are also used when configuring distributed or redundant monitoring installations.
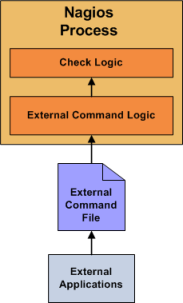
Here's how passive checks work in more detail...
1.An external application checks the status of a host or service.
2.The external application writes the results of the check to the external command file.
3.The next time Nagios reads the external command file it will place the results of all passive checks into a queue for later processing. The same queue that is used for storing results from active checks is also used to store the results from passive checks.
4.Nagios will periodically execute a check result reaper event and scan the check result queue. Each service check result that is found in the queue is processed in the same manner - regardless of whether the check was active or passive. Nagios may send out notifications, log alerts, etc. depending on the check result information.
The processing of active and passive check results is essentially identical. This allows for seamless integration of status information from external applications with Nagios.
Source : https://assets.nagios.com/downloads/nagioscore/docs/nagioscore/3/en/passivechecks.html
| Nagios Checker | |
Nagios Checker est un module pour firefox. Il permet d'avoir un indicateur du statut de nagios dans la barre d'état de firefox.
https://addons.mozilla.org/fr/firefox/addon/nagios-checker/
NB : il est nécessaire d'installer la barre d'état qui s'installe sous forme de module :
https://addons.mozilla.org/fr/firefox/addon/status-4-evar/
| Monitorer les disques d'un linux | |
Créer un utilisateur sur le système distant pour permettre une connexion distante avec clés SSH
Installer sur le serveur distant le paquet nagios-plugins-basic
Tester :
/usr/lib/nagios/plugins/check_by_ssh -H <ip> -l nagios -C "/usr/lib/nagios/plugins/check_disk -w '10%' -c '5%' -p '/'" |
Modifier /etc/nagios-plugins/config/disk.cfg
# 'ssh_disk_5' command definition
define command{
command_name ssh_disk_5
command_line /usr/lib/nagios/plugins/check_by_ssh -H '$HOSTADDRESS$' -l nagios -C "/usr/lib/nagios/plugins/check_disk -w '$ARG1$' -c '$ARG2$' '$ARG3$'"
} |
Ajout du service
define service{
use generic-service ; Name of service template to use
hostgroup_name linux-disk
service_description Current disk use
check_command ssh_disk_5!10%!5%!-p '/'
notification_interval 0 ; set > 0 if you want to be renotified
} |
Note : la surveillance peut également être faite via snmp
| Monitorer un Windows | |
Télécharger NSClient++ (http://nsclient.org/downloads) (je prends le msi 64 bits)
Installation
je n'installe que 'common check plugins' + check_nt
Version 0.4.3.143 : Dans l'onglet plugins, je n'installe que "Check Plugins" et "Check_nt support"
Configuration de nagios
cf http://nagios.sourceforge.net/docs/3_0/monitoring-windows.html
| Monitorer un DELL | |
Installer openmanage
Activer snmp sur le windows
http://wiki.monitoring-fr.org/supervision/snmp-install#installer-snmp-sous-windows
http://www.it-connect.fr/activer-le-snmp-sur-windows-server-2008/
Installer check_openmanage
http://folk.uio.no/trondham/software/check_openmanage.html
http://exchange.nagios.org/directory/Plugins/Hardware/Server-Hardware/Dell/check_openmanage/details
Activer le service dans nagios
Exemple :
define command {
command_name check_dell_openmanage_temp
command_line /usr/lib/nagios/plugins/check_openmanage -H '$HOSTADDRESS$' -C '$ARG1$' -w 0='$ARG2$' -c 0='$ARG3$'
}
define command {
command_name check_dell_openmanage
command_line /usr/lib/nagios/plugins/check_openmanage -H '$HOSTADDRESS$' -C '$ARG1$'
} |
| Les codes retour des plugins | |
Numeric Service Description
Value Status
0 OK : The plugin was able to check the service and it appeared to be functioning properly
1 Warning : The plugin was able to check the service, but it appeared to be above some "warning" threshold or did not appear to be working properly
2 Critical : The plugin detected that either the service was not running or it was above some "critical" threshold
3 Unknown : Invalid command line arguments were supplied to the plugin or low-level failures internal to the plugin (such as unable to fork, or open a tcp socket) that prevent it from performing the specified operation. Higher-level errors (such as name resolution errors, socket timeouts, etc) are outside of the control of plugins and should generally NOT be reported as UNKNOWN states.
Source : https://nagios-plugins.org/doc/guidelines.html#THRESHOLDFORMAT
| Les seuils avec check_snmp | |
Range definition
Generate an alert if x...
10 < 0 or > 10, (outside the range of {0 .. 10})
10: < 10, (outside {10 .. ∞})
~:10 > 10, (outside the range of {-∞ .. 10})
10:20 < 10 or > 20, (outside the range of {10 .. 20})
@10:20 ≥ 10 and ≤ 20, (inside the range of {10 .. 20})
Source : https://nagios-plugins.org/doc/guidelines.html#THRESHOLDFORMAT
| Docs | |
http://www.linuxquestions.org/questions/linux-networking-3/using-nagios-check_snmp-plugin-to-get-snmp-info-from-computer-751057/#post3673978
http://nagios.sourceforge.net/docs/3_0/objectdefinitions.html
|
|
Contact
|
|---|
Pour m'envoyer un mail,
Pour me laisser un commentaire :richard.brunooo
chez
gmail.com |  |
|
|